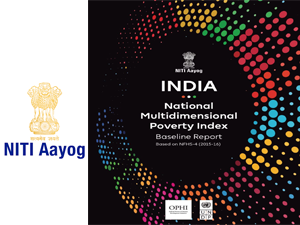
New Delhi (01.12.2021): Apparently, this is the first attempt made by the Government of India to look into the root cause of its poverty problem through a multi-dimensional lens. NITI Aayog comes up with India’s first National Multi-Dimensional Poverty Index (NMPI) for all States-UTs and also all districts!
A proper analysis has been done and a vast report is compiled. The report called NMPI- Baseline Report (based on NFHS-4- 2015-16) released by NITI Aayog gives a mixed bag of success and failure of India’s attempt to alleviate poverty, and the first baseline estimates, as on 2015-16, on incidence and causes of poverty defined in all in dimensions.
This Index underscores the fact that poverty should be viewed from a holistic perspective, rather than from the point of view of income. It is observed in the report that a substantial part of the population continues to be both economically and multi-dimensionally poor. This is the first time that India has attempted to track it.
This Baseline MPI Report is based on the NFHS 4 (data period: 2015-16), and precedes the full rollout of flagship schemes on housing, drinking water, sanitation, electricity, cooking fuel, financial inclusion, and other major efforts towards improving school attendance, nutrition, mother and child health, etc. Hence it serves as a useful source for measuring the situation at baseline i.e. before the large-scale rollout of nationally important schemes. Substantive gains achieved through focused programmatic interventions and flagship schemes since NFHS 4 (2015-16) is reflected in the NFHS 5 (2019-20) factsheets and reports for indicators under the purview of the National MPI. The progress report, a follow-up to the baseline National MPI report, will capture this reduction in multidimensional poverty between 2015-16 (NFHS 4) and 2019-20 (NFHS 5). This report will be released after the unit-level microdata of NFHS 5 is available.
The report does not only talk about national imbalances but also outlines regional imbalances in terms of poverty that the government has always been talking about in its east versus west dichotomy. The government in its efforts initiated a Global Indices for Reform and Growth (GIRG) and a mandate was put out by Cabinet Secretary in 2020. Under this mandate, 28 indices were chosen to improve India’s global position. NITI Aayog was made the Nodal Ministry for the Multidimensional Poverty Index under the GIRG project, and the same has been developed by the SDG Team under Ms Sanyukta Samaddar (IAS:1999:UP), Adviser, SDG, under the able guidance and leadership of Amitabh Kant (IAS:1980:KL), CEO NITI Aayog and Dr Rajiv Kumar, Vice Chairman, NITI Aayog.
Multi-dimensional poverty measures looks at deprivation in three important dimensions – health, education, and the standard of living. They are tracked by indicators for nutrition, access to healthcare, education, access to safe drinking water, sanitation, and housing among others.
Interestingly the country has emerged as the nation with the highest rate of poverty alleviation in recent years with over 27.1 crore people being brought out of poverty between 2006 and 2016 as per United Nation’s Global Multidimensional Poverty Index 2019, but the COVID-19 pandemic and the resultant recession have caused a severe setback to these efforts.
NITI Aayog in its Index has used two more indicators – access to ante-natal care and financial inclusion, as measured by bank accounts. This may perhaps account for the difference in overall multi-dimensional poverty incidence as measured by the UN, which estimated the population in poverty at 36.4 crore in 2019, or 28 percent of the population and the NITI Aayog’s estimation, which pegs it at 25 percent of the population as being multi-dimensionally poor.
There is no surprise element in the findings of the study. As in 2015-16, Bihar, with 51.91 percent of the state’s population multidimensionally poor, is the worst performer, followed by Jharkhand (42.16 percent) and Uttar Pradesh (37.79 percent). The district-level numbers also point to stark inequalities even with states with a high level of poverty. Bihar has as many as 11 districts with a poverty ratio of over 60 percent while UP has three with a ratio of over 70 percent. In contrast, nine out of Kerala’s 14 districts had a poverty ratio of less than one percent.
One must keep in mind that sustainable poverty reduction can only be achieved when the focus is on improving household incomes through a multi-pronged approach of education, skilling and job creation, along with the provision of healthcare and financial inclusion. With this report in hand, it appears that some serious efforts for poverty alleviation are in the offing.


